It’s embarrasing to admit this but in our earnings season preview on April 12, when the consensus estimate reflected a nearly 24% increase, we wrote that S&P 500 Index earnings growth for the first quarter could potentially exceed 30%. Fast forward to today and earnings growth for the quarter is on pace to double—yes, double—that 24% growth rate, which would mark one of the biggest upside surprises ever recorded. Here we look at how corporate America produced such a blowout earnings season and what it could mean for the outlook.
Blowout Numbers
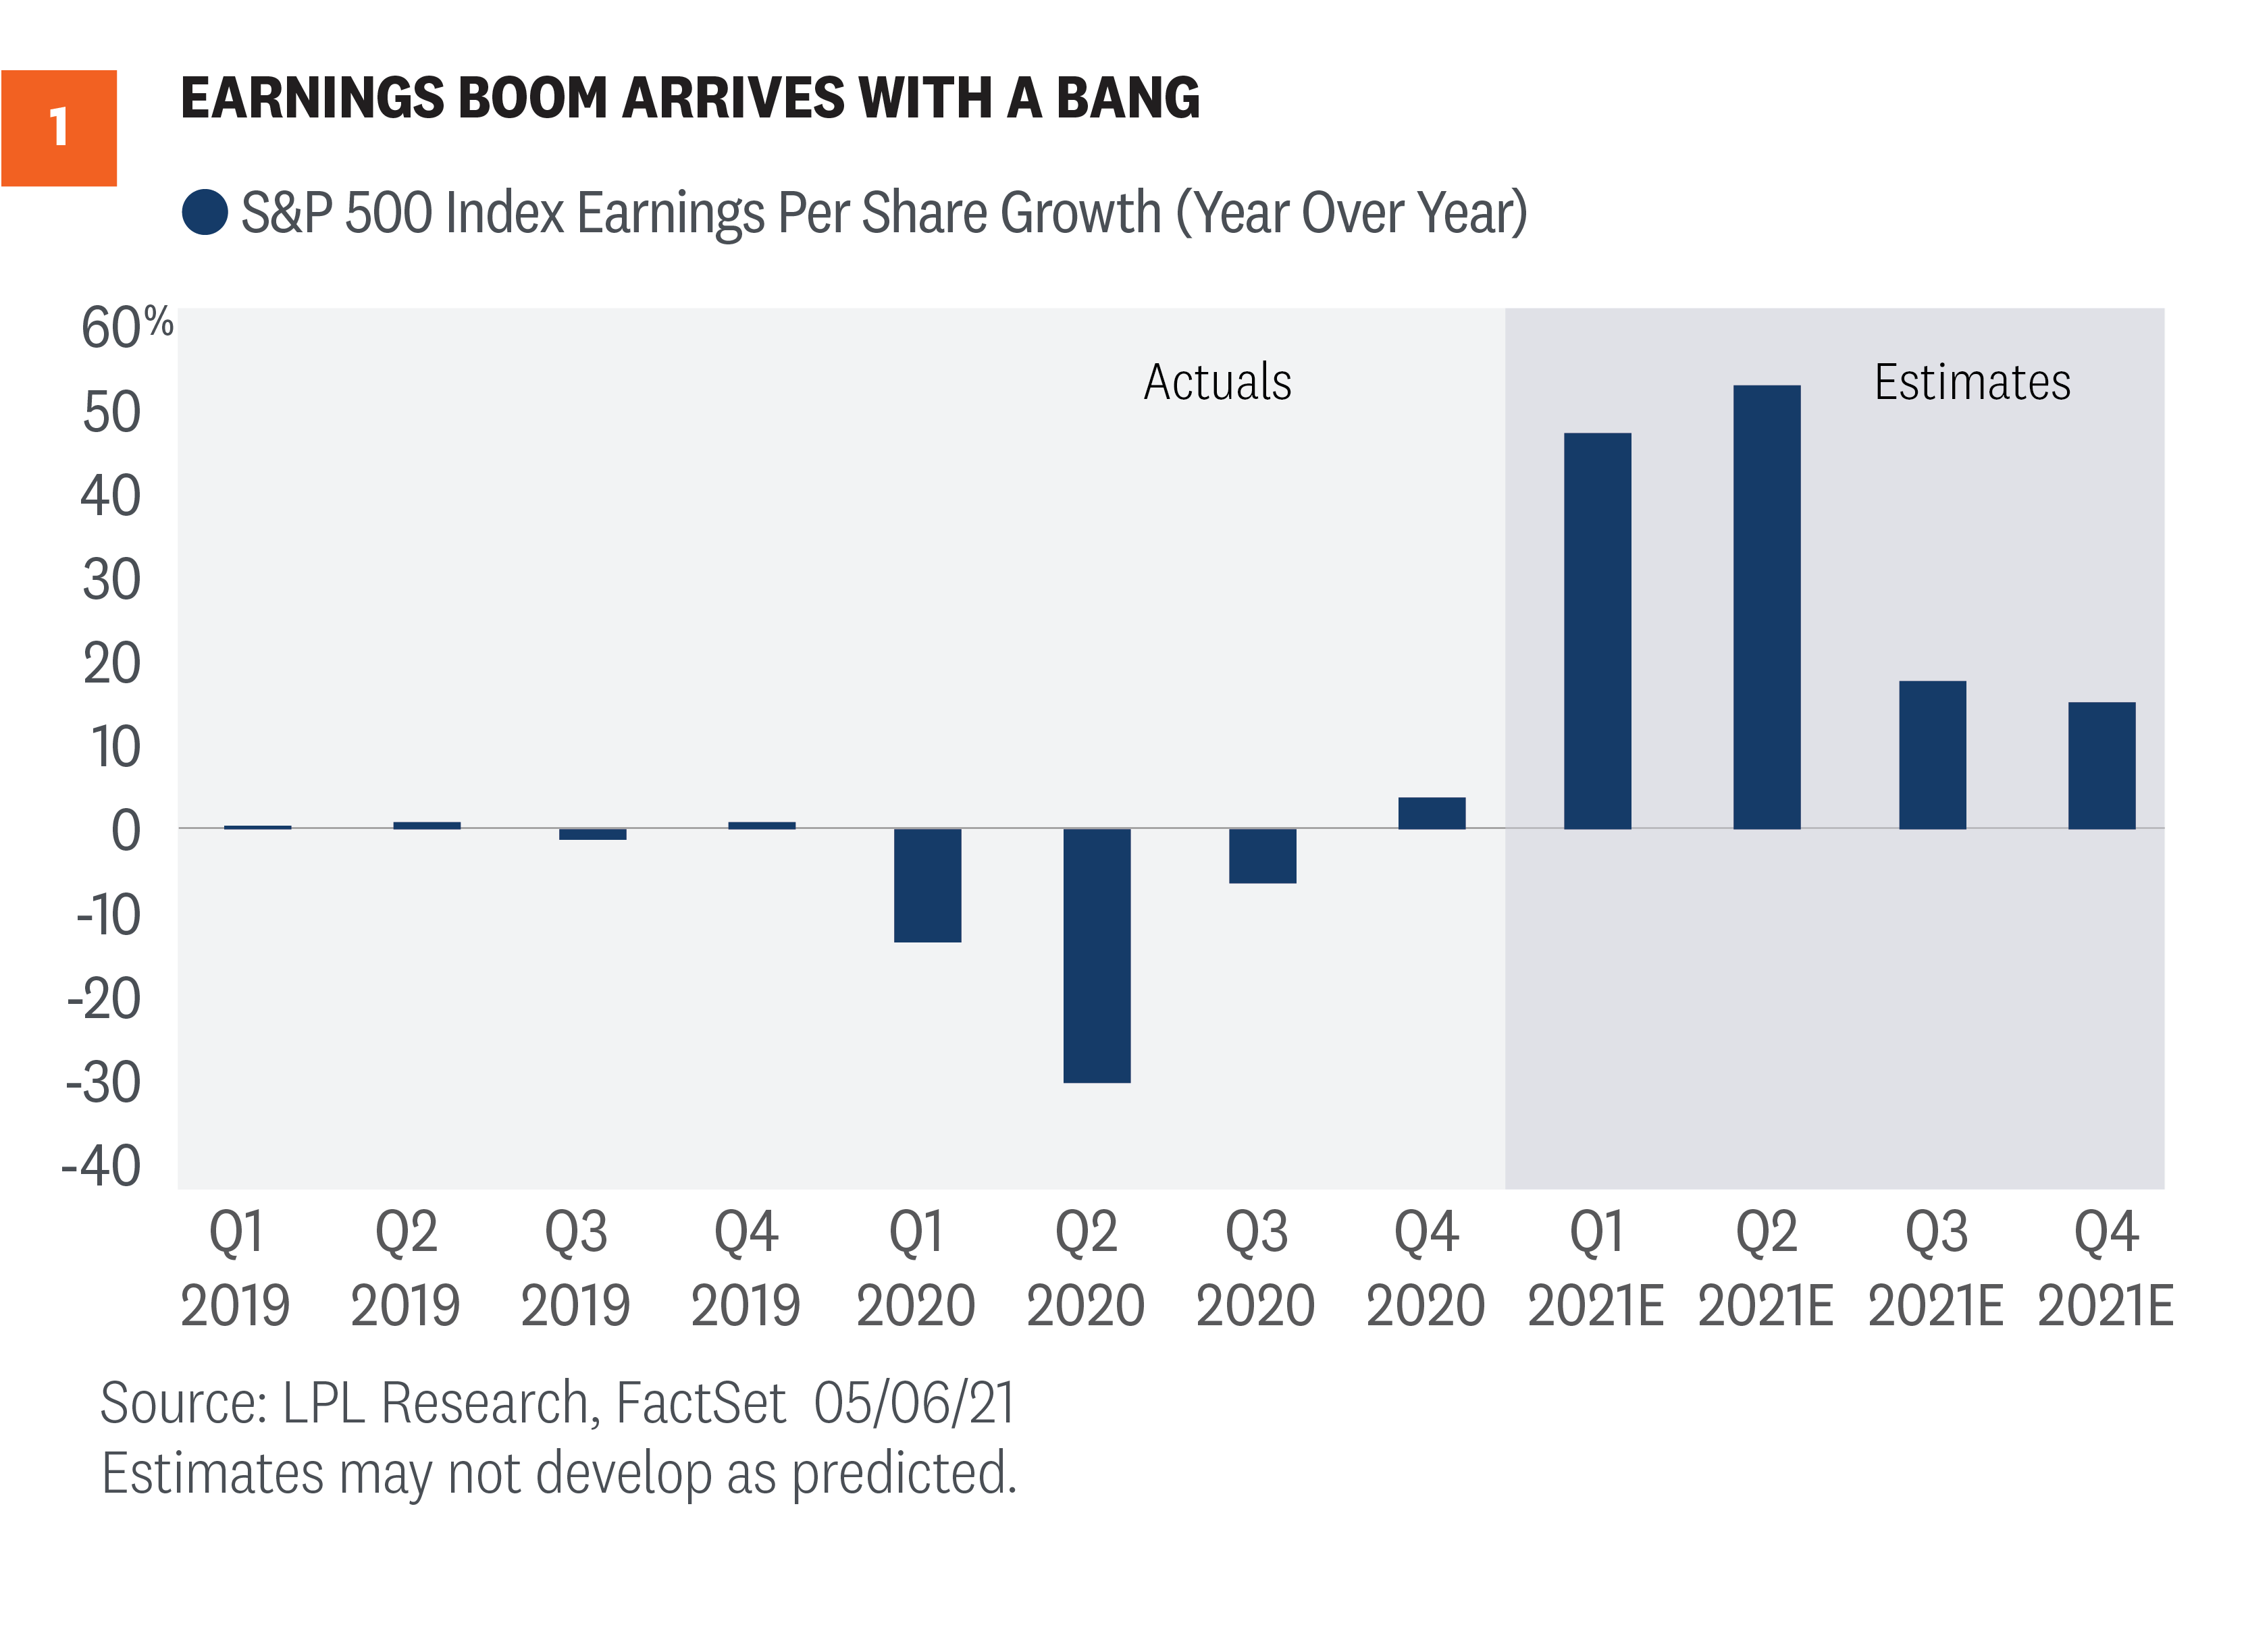
To call this earnings season a blowout would be an understatement. We wrote in our earnings preview that the combination of strengthening economic growth, booming manufacturing activity, rising estimates and positive guidance could potentially lead to double-digit upside, which implied earnings growth of about 35%. As shown in [Figure 1], with nearly 90% of S&P 500 constituents having reported, S&P 500 earnings growth is tracking to a 49% year-over-year increase.
We’ve been closely following these earnings numbers for well over a decade and have never been more surprised by the amount of upside than we were this earnings season. Analysts’ estimates have historically been too conservative coming out of recessions. They tend to miss turns in economic conditions, they underestimate companies’ ability to adapt to changing conditions, and guidance from corporate management teams tends to be conservative.
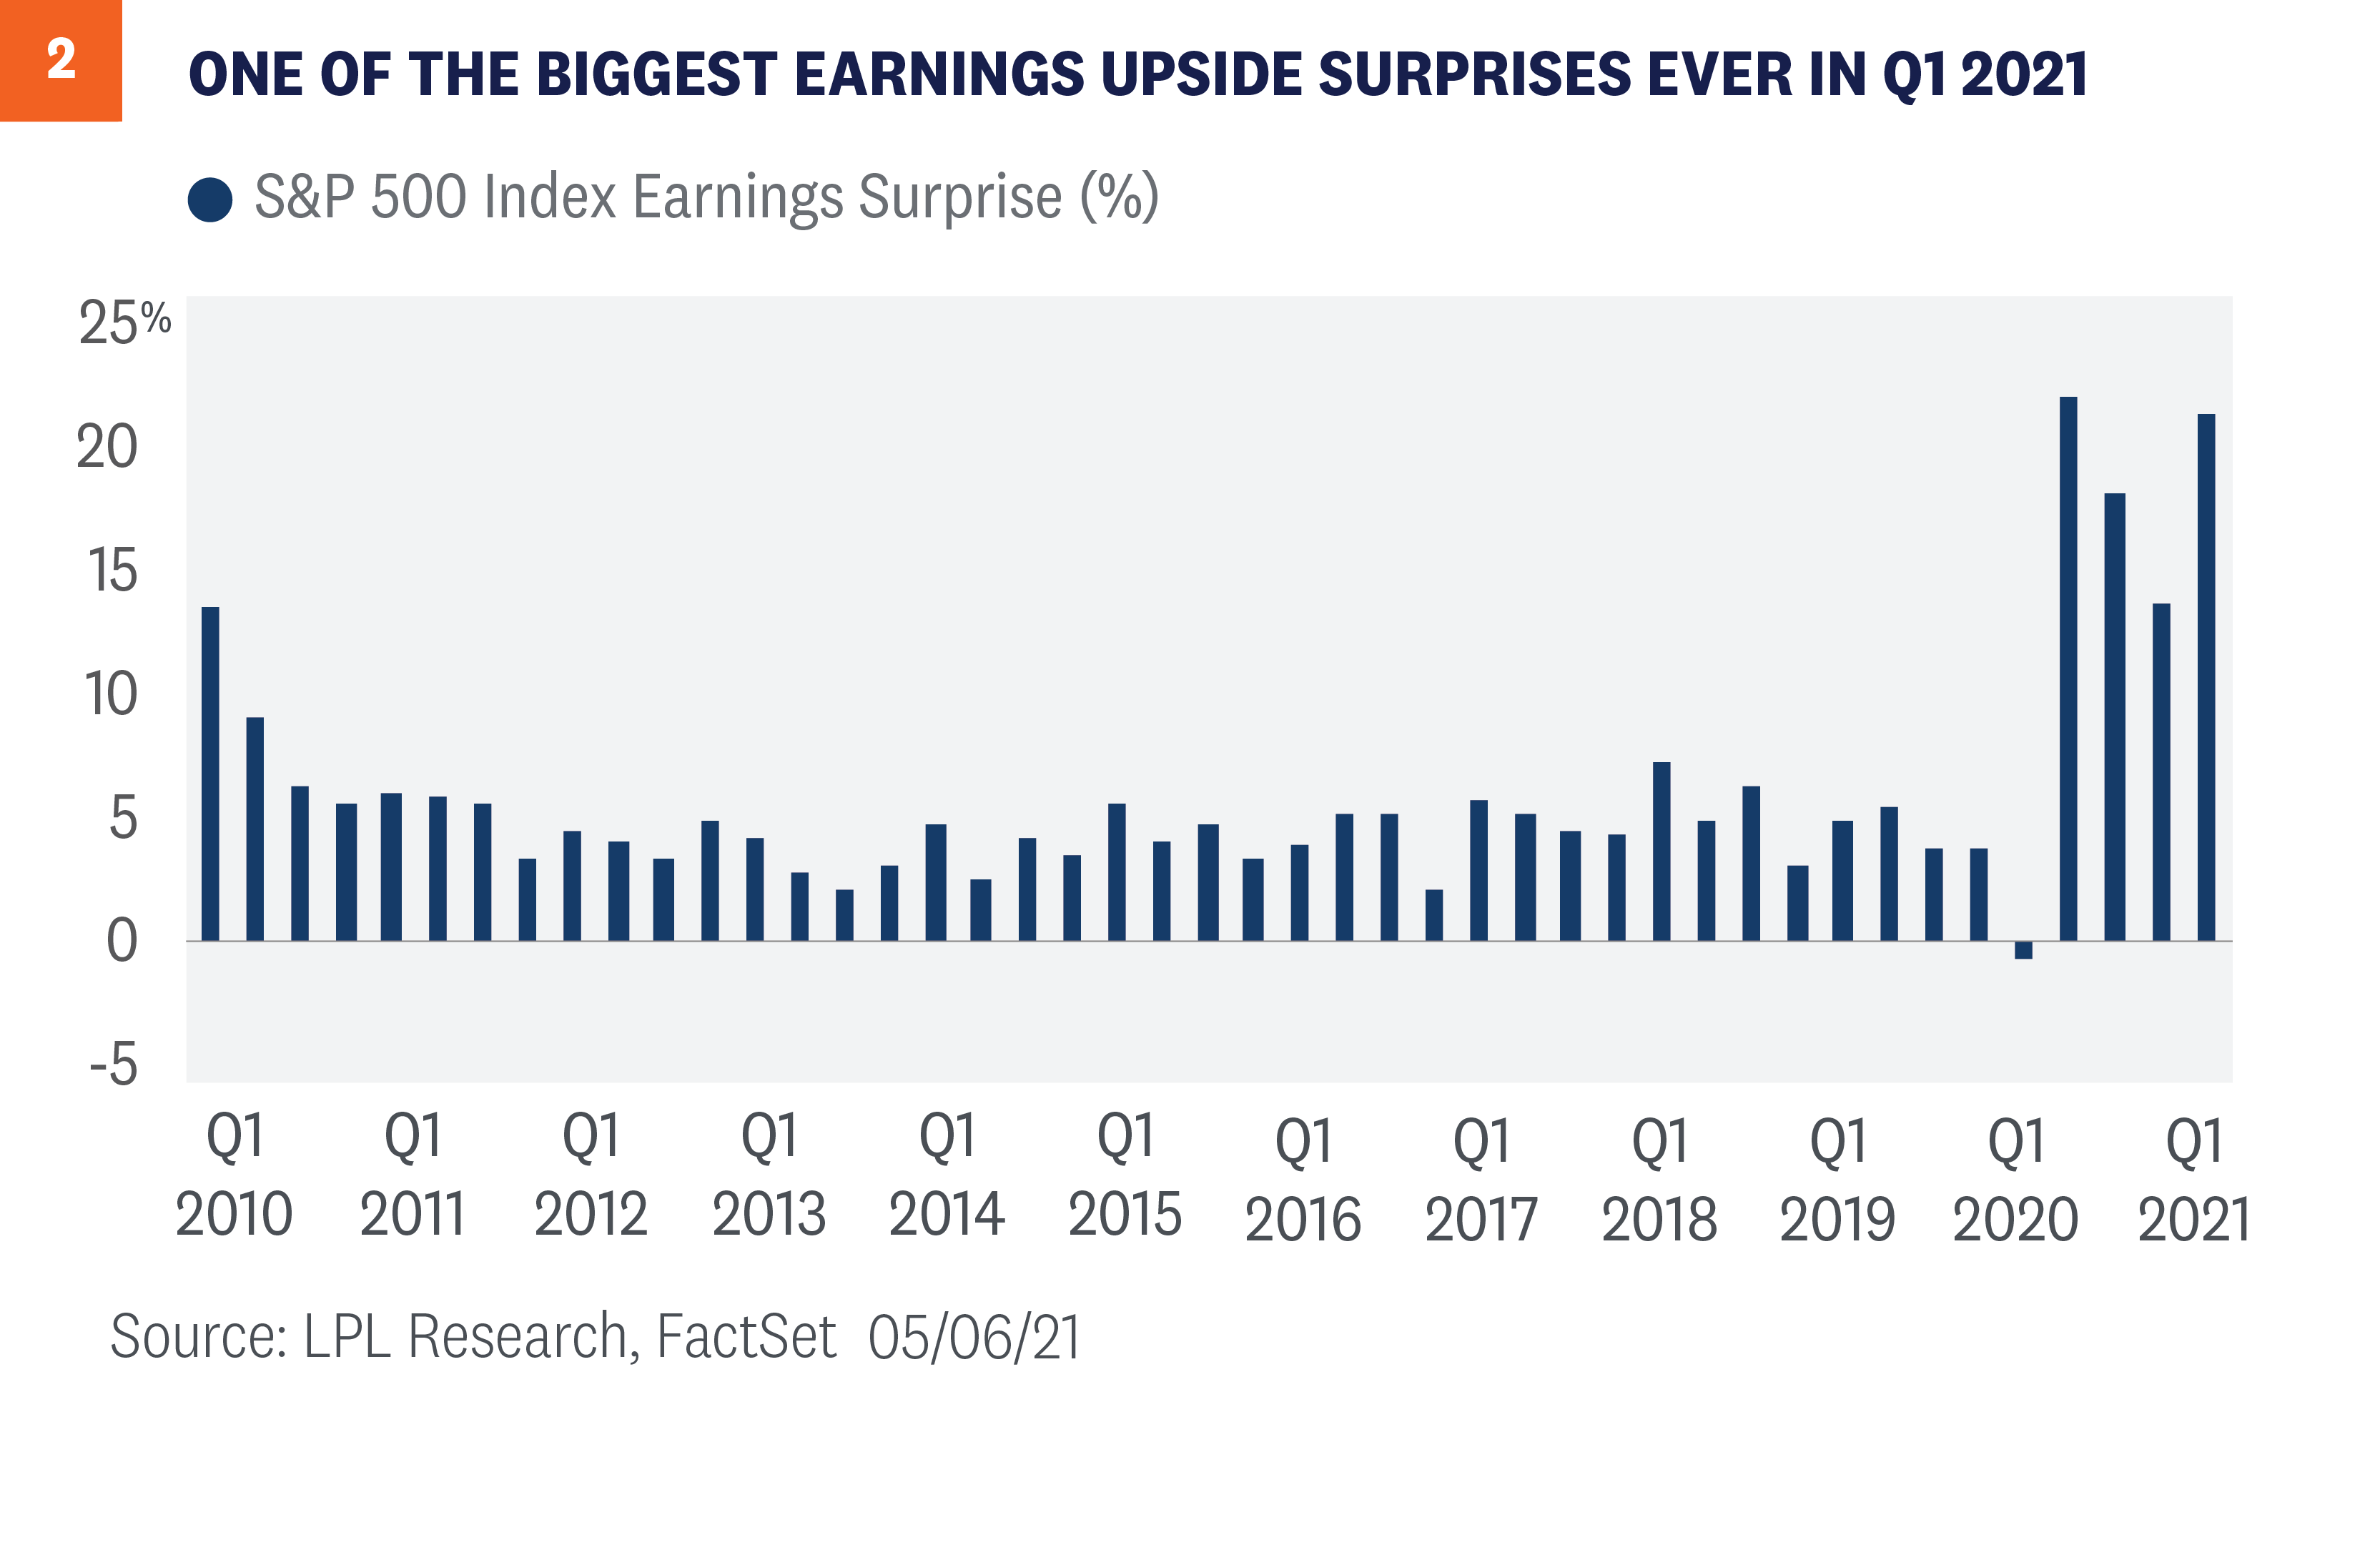
But after three quarters of huge upside surprises (the second, third and fourth quarters of 2020), we expected analysts to catch up. Clearly, they haven’t—because the 13 percentage points of upside to fourth-quarter earnings is being followed by a 23-percentage-point upside surprise so far for the first quarter of 2021 [Figure 2]. Keep in mind the average upside going back to 2010 is 6%. That 23 points is enormous.
Revenue upside was even more impressive (if you can believe that), as stronger economic growth helped drive the biggest upside surprise to revenue ever recorded at over 4 percentage points. Pandemic winner technology contributed most to the revenue upside and grew revenue 21%, the fastest of all S&P 500 sectors.
Where Did All This Strength Come From?
We attribute the earnings strength to a number of factors:
- Reopening progress. The biggest earnings upside surprises for the quarter came from consumer discretionary, energy, and financials—all areas of the economy dependent on the reopening. The pace of the reopening appears to have caught analysts and corporate management teams by surprise.
- Booming manufacturing activity. The Institute for Supply Management (ISM) Manufacturing Index hit a 37-year high near 65 during March. Manufacturing activity, which has historically correlated well with earnings, has come back stronger than most analysts had anticipated.
- Tremendous efficiency. Companies have done an outstanding job of managing costs during the pandemic. Amid all the attention on inflation fears during earnings conference calls, corporate America is on track to produce its most profitable quarter ever recorded in terms of net profit margins for the S&P 500.
- Strong credit environment. Financials delivered the second-biggest upside earnings surprise at 35% (behind consumer discretionary’s 75% blowout), bolstered by lower-than-expected credit losses and releases of loan loss reserves.
- Rising commodity prices. Energy has delivered the biggest upside earnings surprise at 38%, while the materials sector is on track to grow earnings 64% year over year.
- Weakening U.S. dollar. The U.S. dollar was about 6% lower in the first quarter of 2021 than in the year-ago quarter, which we estimate boosted S&P 500 earnings by about 2 percentage points overall.
All earnings data sourced from FactSet.
Outlook Keeps Getting Better
For us, the most important barometer of results is always guidance and the path of future estimates. The S&P 500’s 5.2% advance in April came as results started rolling in.
One of the reasons we were optimistic about upside coming into first-quarter earnings season was the guidance ratio. During the first quarter, an unusually high 64% of S&P 500 companies that provided formal guidance pushed numbers higher. For the second quarter, that number is similarly strong at 63%. This level of optimism is rare—the five-year average guidance ratio is 35%.
Positive guidance has pushed the consensus estimate for S&P 500 earnings per share in 2021 significantly higher, from $176 on March 31 to $187 as of May 6. Year to date, the 2021 earnings estimate has increased by $20 per share, or 12%, which perhaps—not coincidentally—is about what the S&P 500 Index has returned so far in 2021.
Updated Thoughts on 2021
On April 5, we raised our S&P 500 earnings per share (EPS) estimate for 2021 to a range of $175—$177.50 because of our improved economic outlook and additional fiscal stimulus. With FactSet consensus at $187 following the blowout first-quarter results and strong guidance, our earnings forecast looks too low.
The macroeconomic environment suggests potential upside to consensus forecasts, but the COVID-19 surge in some countries around the world, particularly in India, introduces some risk. A pickup in inflation from upward pressures in wages, supply shortages, or higher commodity prices, could easily hamper further profit margin improvement. The same goes for potentially higher interest rates. Finally, analysts’ estimates should catch up to reality at some point, so perhaps that starts to happen in the second or third quarter.
Weighing the macroeconomic and business tailwinds against these risks, we believe $187.50-$190 per share is a reasonable expectation for S&P 500 earnings in 2021.
Raising S&P 500 Fair Value Target
First-quarter earnings were truly remarkable. In fact, results and guidance were so good that we were left with little choice but to lift our earnings forecasts just a month after our last increase. The economic backdrop remains favorable, supported by vaccine distribution, the reopening, and massive stimulus. The stronger earnings growth has enabled stocks to grow into their valuations. As a result, we are raising our 2021 year-end S&P 500 fair value target range to 4,400 – 4,450, which is 4% above the May 7 close at the low end of the range.
We acknowledge there are risks to that higher forecast, including COVID-19 spread outside the U.S., deficit spending, geopolitics, inflation, and tax increases. Though justified by low interest rates, stock valuations are elevated. After a nearly 90% rally off the March 2020 lows, the S&P 500 may be due for a pause. So, while our outlook for stocks remains positive, we believe returns over the balance of the year may be modest and come with more volatility.
IMPORTANT DISCLOSURES
This material is for general information only and is not intended to provide specific advice or recommendations for any individual. There is no assurance that the views or strategies discussed are suitable for all investors or will yield positive outcomes. Investing involves risks including possible loss of principal. Any economic forecasts set forth may not develop as predicted and are subject to change.
References to markets, asset classes, and sectors are generally regarding the corresponding market index. Indexes are unmanaged statistical composites and cannot be invested into directly. Index performance is not indicative of the performance of any investment and do not reflect fees, expenses, or sales charges. All performance referenced is historical and is no guarantee of future results.
Any company names noted herein are for educational purposes only and not an indication of trading intent or a solicitation of their products or services. LPL Financial doesn’t provide research on individual equities.
All information is believed to be from reliable sources; however, LPL Financial makes no representation as to its completeness or accuracy.
US Treasuries may be considered “safe haven” investments but do carry some degree of risk including interest rate, credit, and market risk. Bonds are subject to market and interest rate risk if sold prior to maturity. Bond values will decline as interest rates rise and bonds are subject to availability and change in price.
The Standard & Poor’s 500 Index (S&P500) is a capitalization-weighted index of 500 stocks designed to measure performance of the broad domestic economy through changes in the aggregate market value of 500 stocks representing all major industries.
The PE ratio (price-to-earnings ratio) is a measure of the price paid for a share relative to the annual net income or profit earned by the firm per share. It is a financial ratio used for valuation: a higher PE ratio means that investors are paying more for each unit of net income, so the stock is more expensive compared to one with lower PE ratio.
Earnings per share (EPS) is the portion of a company’s profit allocated to each outstanding share of common stock. EPS serves as an indicator of a company’s profitability. Earnings per share is generally considered to be the single most important variable in determining a share’s price. It is also a major component used to calculate the price-to-earnings valuation ratio.
All index data from FactSet.
Please read the full Outlook 2021: Powering Forward publication for additional description and disclosure.
This research material has been prepared by LPL Financial LLC.
Securities and advisory services offered through LPL Financial (LPL), a registered investment advisor and broker-dealer (member FINRA/SIPC). Insurance products are offered through LPL or its licensed affiliates. To the extent you are receiving investment advice from a separately registered independent investment advisor that is not an LPL affiliate, please note LPL makes no representation with respect to such entity.
| Not Insured by FDIC/NCUA or Any Other Government Agency | Not Bank/Credit Union Guaranteed | Not Bank/Credit Union Deposits or Obligations | May Lose Value |
RES-742650-0521 | For Public Use | Tracking # 1-05142065 (Exp. 05/22)